
Let's switch angles: so far, our case studies focused on a single page at a time (one audit, one piece of writing). This time, we zoom out and look at a website as a whole. The context: a jewelry e-commerce site, several years of history, 7 586 pages indexed by Google, ~32 000 clicks and 6 million impressions over the last 90 days. Not bad at all on paper — but what actually pays off, and what is dragging the site down without anyone noticing? That's exactly the job of the SEO Health module.
We'll walk through the full method: connecting Google Search Console, choosing the period, reading the diagnosis and sorting actions by priority. All the screenshots and figures in this article come from a real audit. The URLs have been anonymized — the metrics, on the other hand, are real.
Step 1 — Connect Google Search Console
The SEO Health module works on your Google Search Console (GSC) data: clicks, impressions, CTR and average position, cross-referenced at the query × page level. So the first mandatory step is to connect your Google account. Head to My integrations in your workspace, then hit the connect button. It's official OAuth, in read-only mode: Horusium absolutely cannot modify anything on your Search Console or your Google account.
You can connect several Google accounts (personal, agency, clients) and pick which one to use for each audit. Handy when you juggle multiple projects.
Step 2 — Launch the audit
Head to the SEO Health page and click New audit. Three choices: the GSC property to analyze, the Google account if you have several, and the analysis depth:
- 90 days — a recent snapshot, ideal for a quarterly review or a rough audit before digging deeper;
- 180 days — a good compromise if your business has some seasonality;
- 365 days — an annual view, perfect for a year-end review or a highly seasonal site.
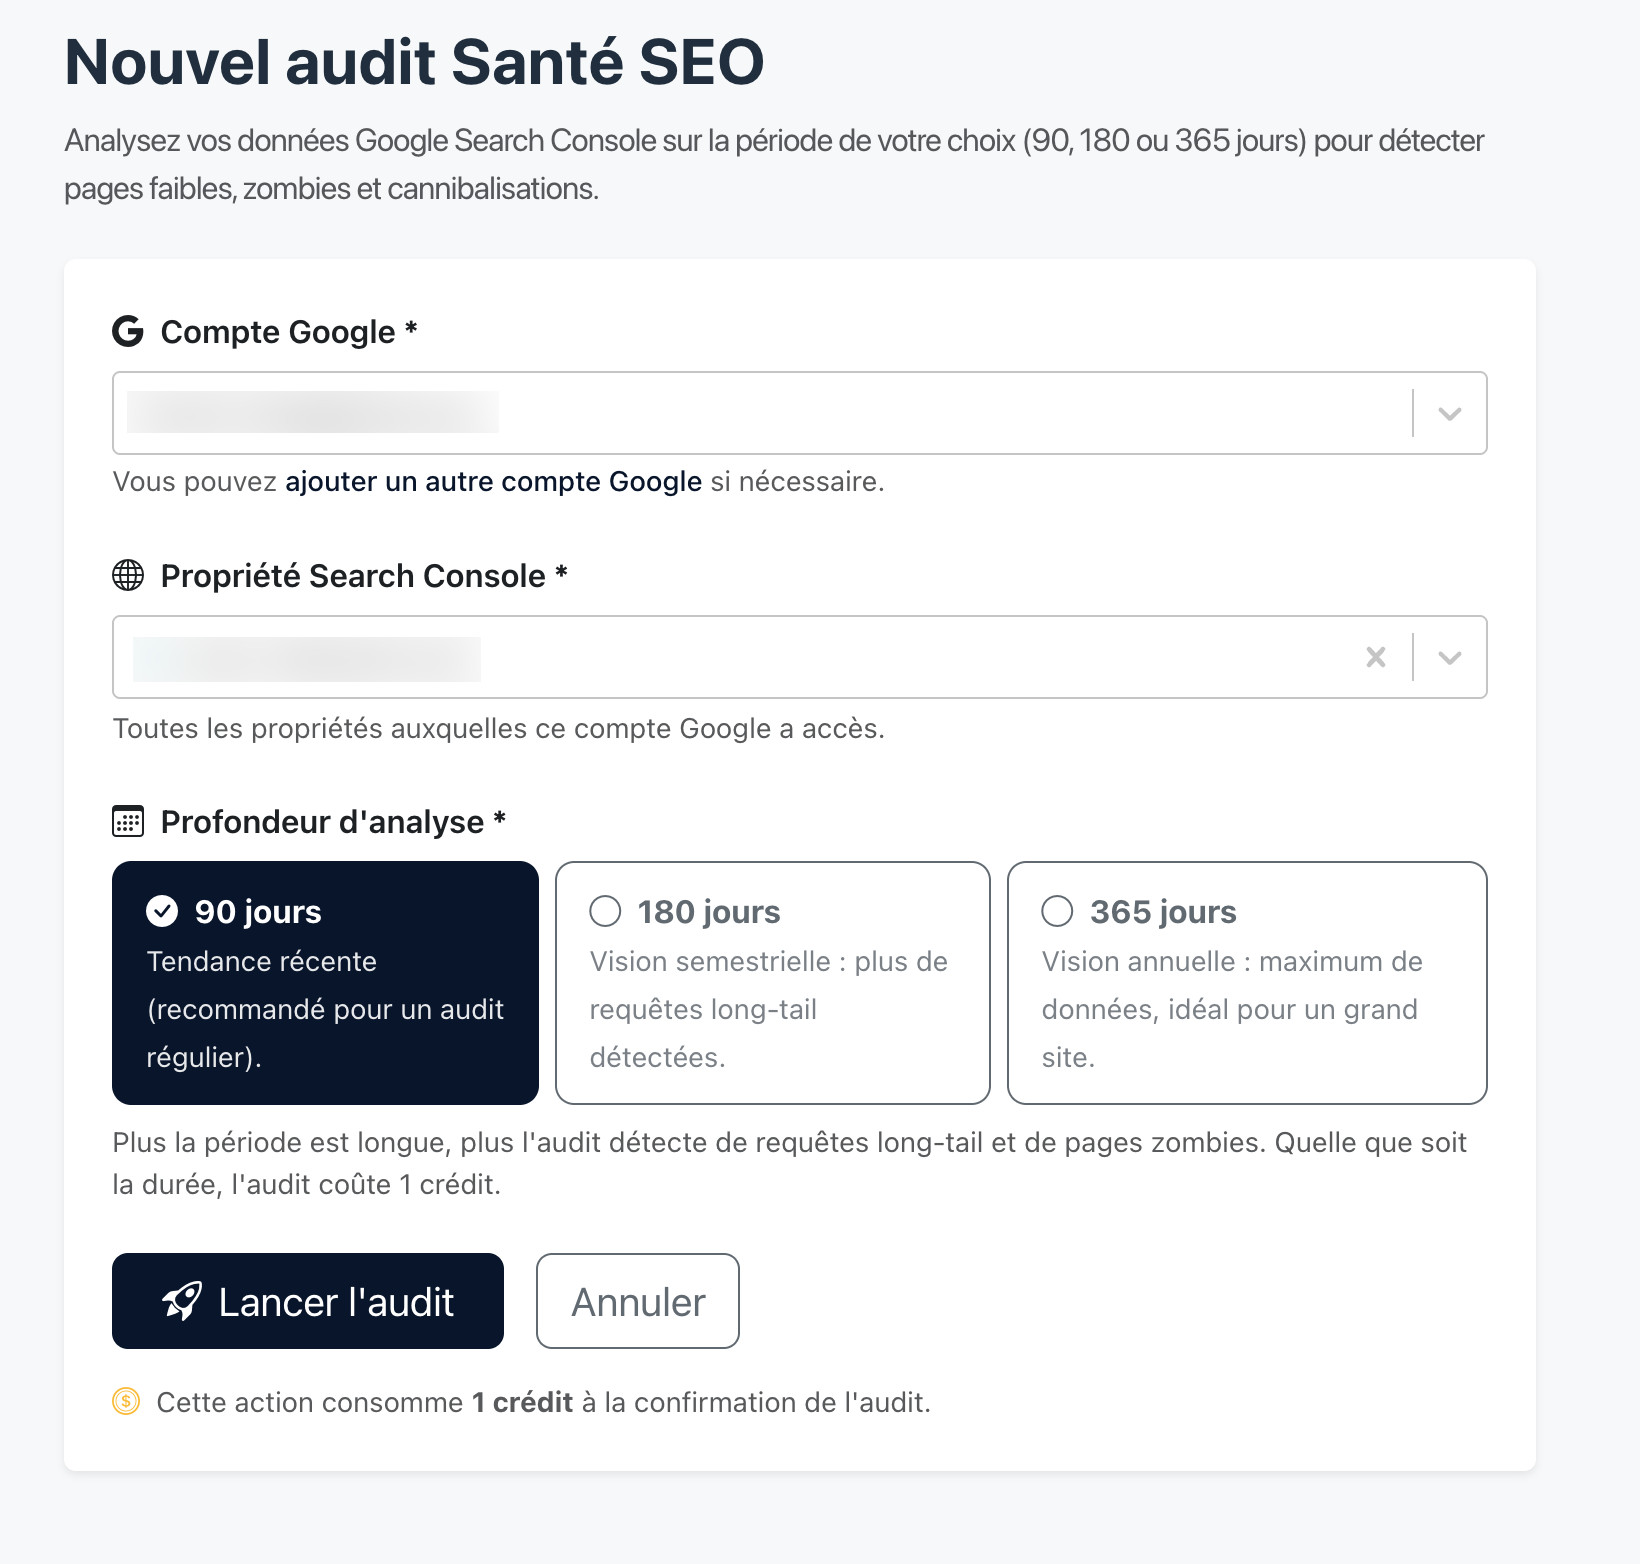
Here, we go with 90 days: it's a first audit, we want a recent snapshot before investing the time of an annual audit. For the record, under the hood Horusium pulls all your GSC queries over the period, analyzes every query × page pair, detects cannibalizations, computes an SEO value score per page and a prioritized action plan. A full audit takes one to a few minutes depending on the size of the site and the depth you picked.
Cost: 1 credit.
Step 3 — Read the Dashboard
Audit done. The Dashboard is organized into three blocks you read top to bottom.
Overall performance
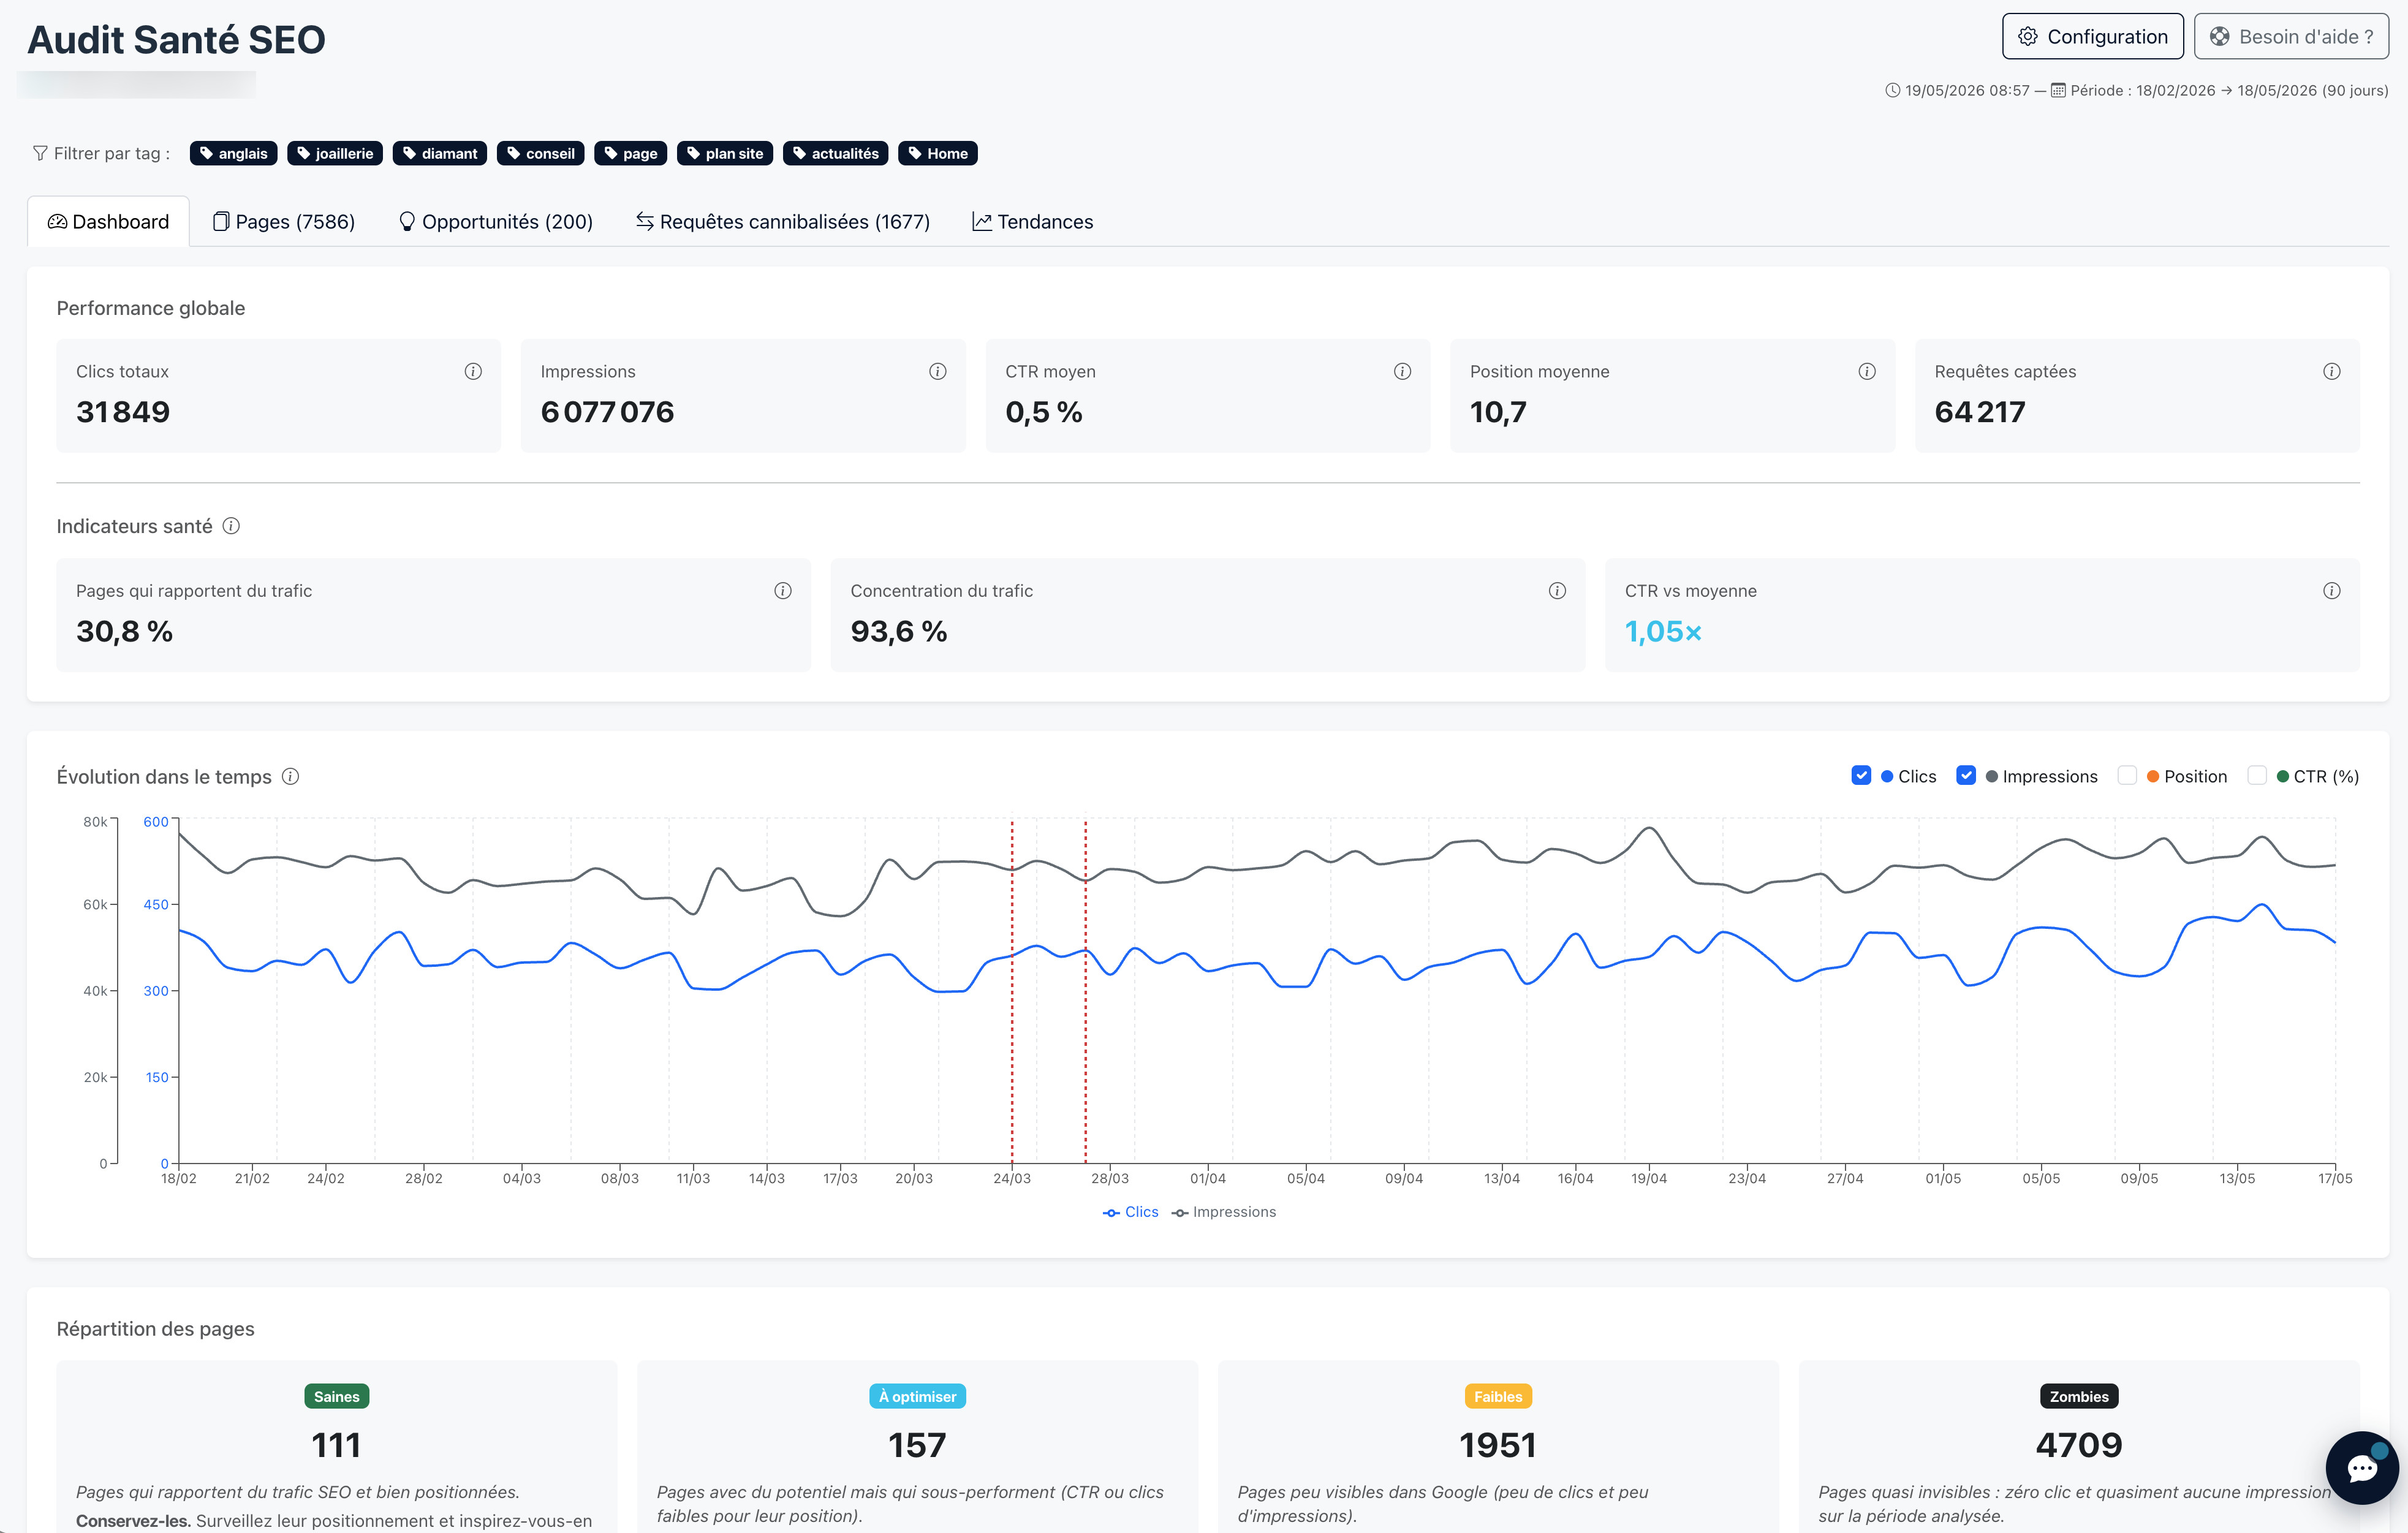
Five cards lined up: clicks, impressions, average CTR, average position, number of queries captured. On our site: ~32 000 clicks, 6 077 076 impressions, average CTR 0,52 %, average position 10,7, 64 217 distinct queries. The average position and the query volume confirm that the site captures a lot, but the very low CTR already sets the tone: there's dead weight.
Health indicators
Three quality cards, more telling than raw volumes:
- Pages that bring in traffic: the share of pages that got at least one click over the period. Here: 30,8 %. In other words, out of 7 586 indexed pages, 5 252 never received a single click in 90 days. That's the real topic of the day.
- Traffic concentration: the share of clicks captured by the top 10 % of pages. The higher this figure, the more your SEO rests on a small core: fragile.
- CTR vs the average across sites: your CTR compared to the average CTR observed across all audited sites at the same SERP position. It's an indicator of the quality of your snippets (title + meta description).
Page breakdown by status
The most actionable part. Each page gets a final status computed from its traffic, its position, its CTR and its role in the detected cannibalizations. Seven possible statuses, each with its own recommended action.
On our site, here's the picture:
- 111 healthy pages (1,5 %) — the core that pays off;
- 157 to optimize (2,1 %) — potential to unlock;
- 1 951 weak (25,7 %) — anemic traffic;
- 4 709 zombies (62,1 %) — no clicks, near-zero impressions;
- 223 parasites (3 %) — capture traffic at the expense of other pages on the site;
- 107 cannibalized (1,4 %) — share their queries with other internal URLs;
- 328 to verify (4,3 %) — not enough data to decide, to review manually.
The real message. 1,5 % healthy pages is obviously very low — but it's very common on a large e-commerce catalog where Google automatically indexes every product page, every variation, every pagination page. The goal isn't to have 100 % healthy pages: it's to identify the ones you can push up, and to neutralize the ones doing harm.
Step 4 — Read the evolution curve
Right below the three blocks, the Dashboard shows a daily evolution curve. Four stackable metrics: clicks, impressions, position, CTR. By default, clicks + impressions are on. Very useful for spotting a traffic drop and dating it precisely.
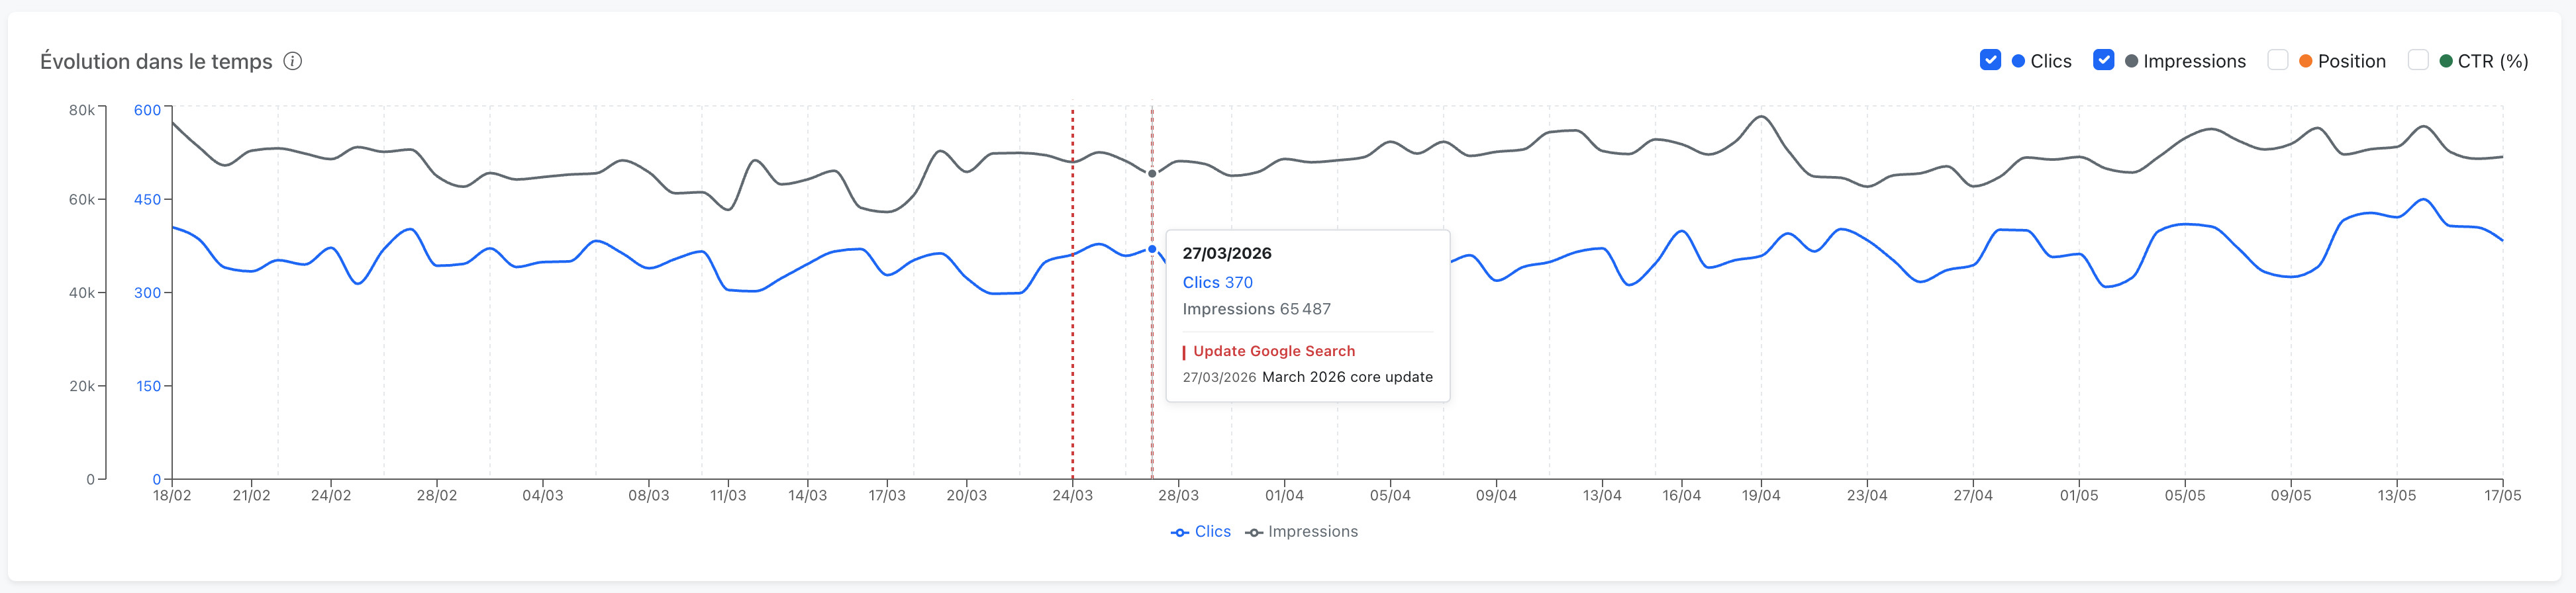
A detail we appreciate: the Google updates published on the Google Search Status Dashboard (core updates, spam updates, ranking or indexing incidents) are projected directly onto the curve as red vertical lines. On hover, the tooltip shows the title and date of the update. If your site took a hit during a core update, you see it at a glance — no more manually cross-referencing with an external site.
Step 5 — Handle the parasite pages
Now that we have the picture, we get to work. My reflex on a large site: start with the parasites. A parasite page is a page that loses traffic to another URL on the site — typically an old article that grabs queries you want to steer toward a newer, better-made page. As long as the parasite stays in place, traffic gets scattered and the good page can't emerge.
Head to the Pages tab, filter status on parasite. Default sort is the priority score: we start from the top.
Opening a parasite page: the decisive screen
Click a row and the detail modal opens. It's the most important screen of the module: you have everything you need to decide, in a single view.
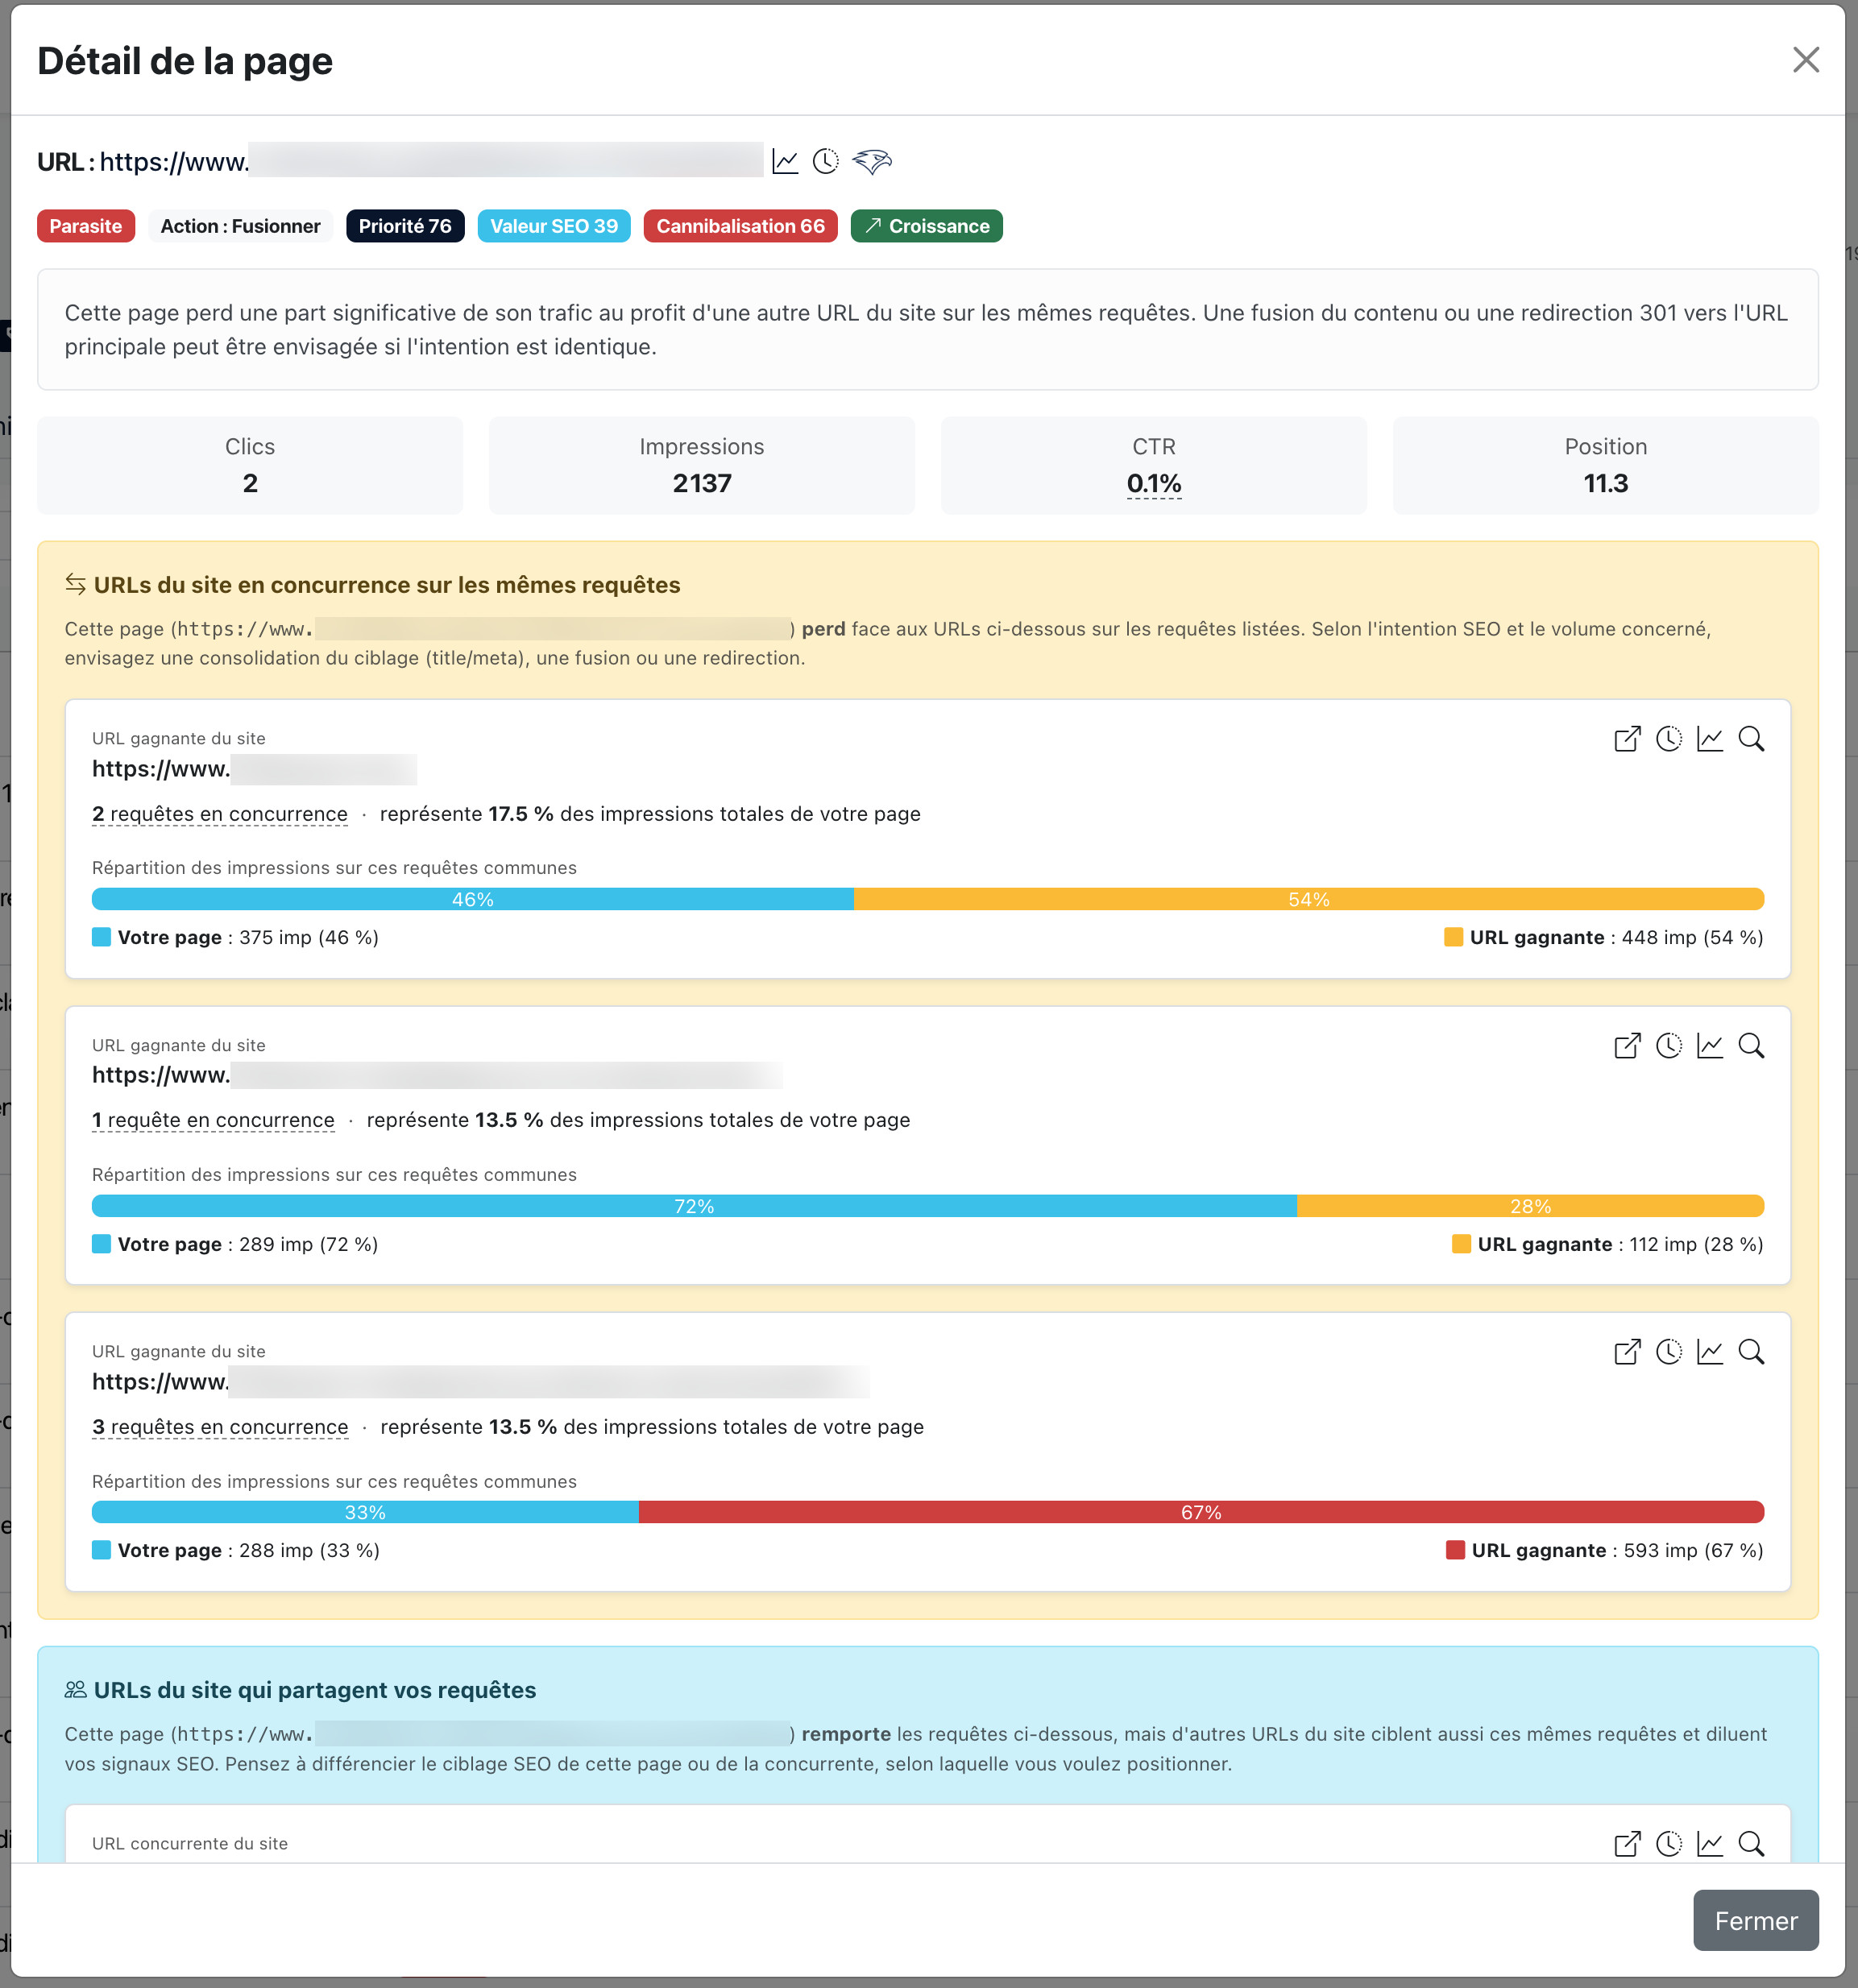
A concrete example taken from our audit. The number 1 page in the parasite ranking:
- 26 queries captured, average position 11,3;
- 2 137 impressions over 90 days;
- 2 clicks in total (CTR ~0,1 %);
- cannibalization score 65,8/100, SEO value score 39,5/100.
Verdict in plain terms: this URL is visible on 26 interesting queries, but it converts almost no impression into a click. And half its traffic is captured by another URL on the site that started ranking better than it in the meantime.
The “Site URLs competing on the same queries” block
On the modal, this alert block at the bottom does all the work. For each winning URL on the site identified, Horusium shows:
- the number of competing queries (click it and a tooltip unfolds the full list);
- the share of the current page's traffic that goes to the winning URL;
- a breakdown bar of impressions on the shared queries — blue segment = you, red segment = the winning URL.
In the case of parasite number 1, the block identifies two winning URLs on the site and the merge action is recommended: 301-redirect the old URL to the new one, consolidate the content if necessary, and move on. In a few minutes per page, you neutralize a leak. At the scale of 223 parasites, that's a big lever.
Step 6 — Clean house: zombies and weak pages
Once the parasites are handled, we tackle the biggest volume: the zombies and the weak pages. On our site, together they represent 6 660 pages — the overwhelming majority of the catalog.
A quick reminder of the definitions:
- Zombie: no clicks and near-zero impressions over the period. These pages bring nothing to the site's SEO, and their accumulation dilutes Google's crawl budget as well as the domain's authority.
- Weak: very few clicks and few impressions. An existing page but with anemic traffic.
On a large e-commerce catalog, you typically find two families of zombies:
- Product pages never clicked — color or size variations, old references, products not featured in the menu. Action: if they're truly orphaned and without potential, you de-index them (noindex meta robots tag) or phase them out gradually. If they have commercial potential, you rework the page (title, description, photos, integration into internal linking).
- Outdated editorial pages — old news, past-event articles, expired promo pages. Action: archive, redirect to the category hub, or rework if there's still a recurring topic.
To sort through thousands of URLs, we rely on three tools in the module:
- the sort by priority score: even among zombies, some carry a few dozen impressions and deserve a quick cleanup rather than a brutal de-indexing;
- the regex tags to group URLs by family (pagination, English version, old news articles…) and hide with a click those that shouldn't weigh in the diagnosis — detailed in the bonus at the end of the article;
- the CSV export of the Pages tab, which you open in a spreadsheet and share with the production team to arbitrate in bulk.
One non-negotiable rule: you never de-index or delete without re-reading the page. None of the actions recommended by Horusium run automatically — it's decision support, not autopilot. Domain knowledge remains your only weapon to decide.
Step 7 — Seize the opportunities
We've cleaned house. Now, we look for pages that can rise easily. That's the whole point of the Opportunities tab: it identifies the Google queries where your site already has visibility, but where traffic doesn't match the potential.
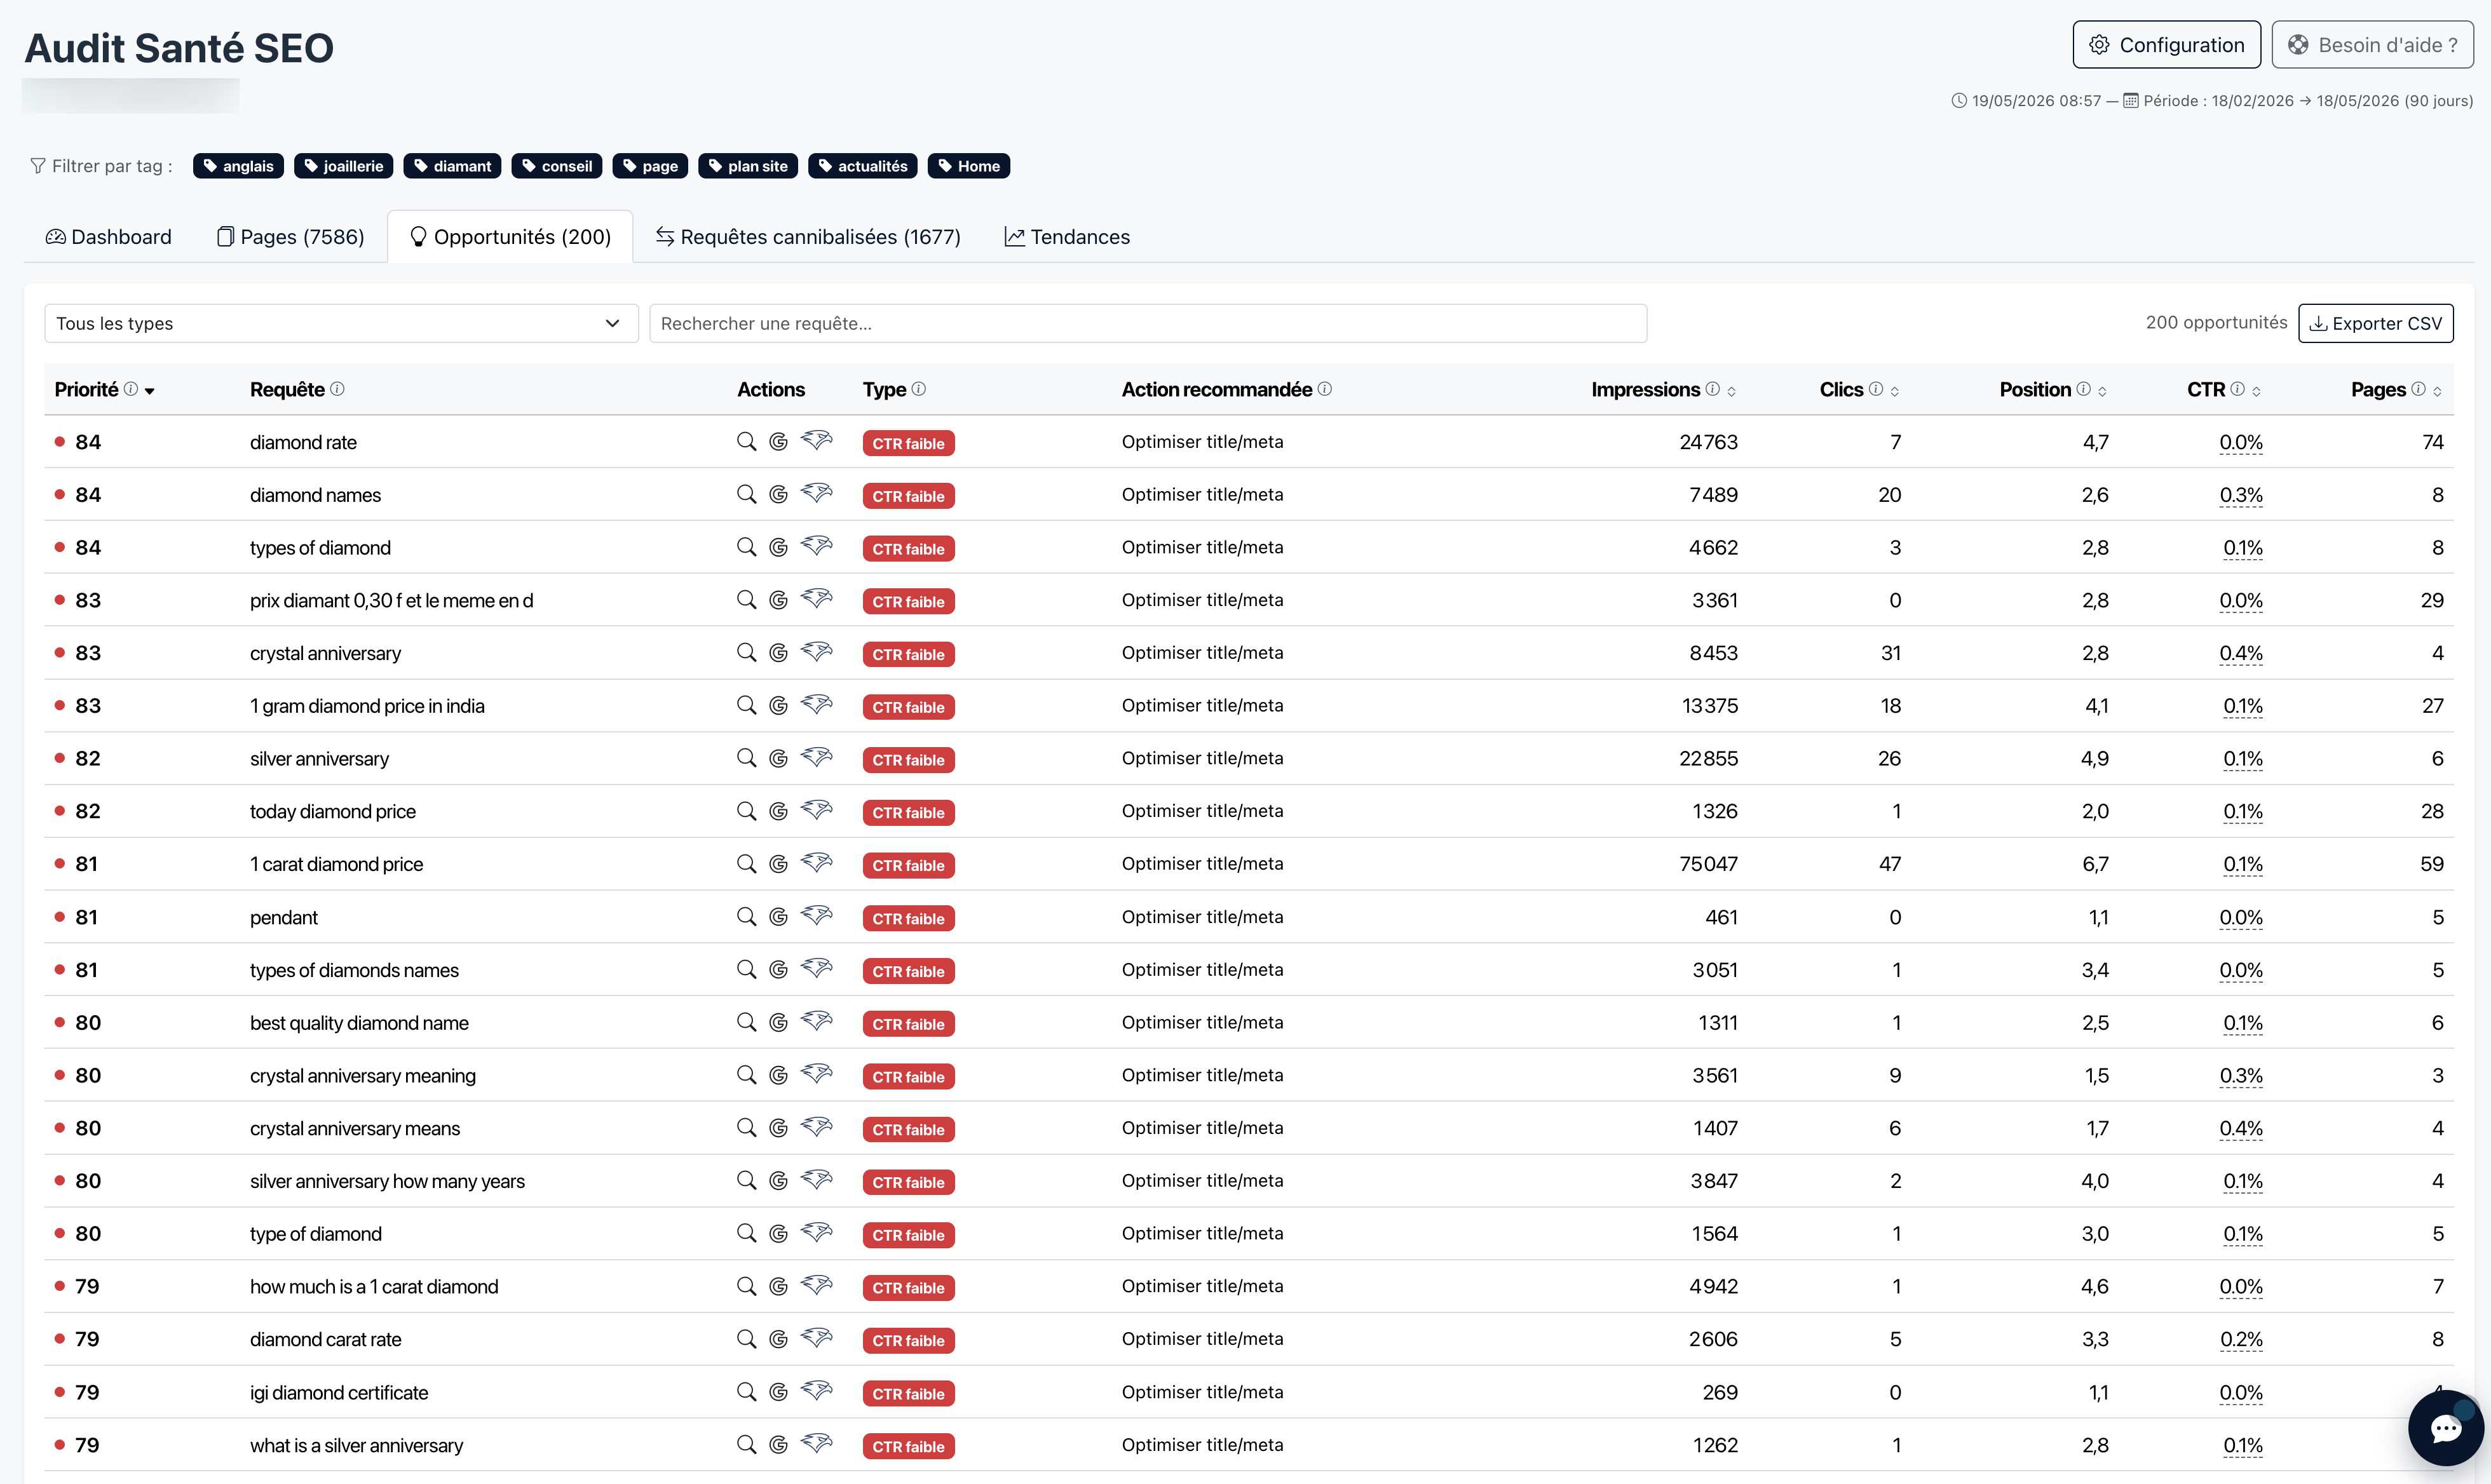
Three types detected:
- Low CTR: decent position (top 8), but few clicks. The snippet (title + meta description) doesn't make people want to click. Action: optimize the snippet.
- Scattered: several URLs on the site rank on the query without any one really dominating. Action: consolidate onto one page, or create a dedicated page if the query deserves it.
- Underexploited: position in low page 1 or page 2 (positions 8 to 30), CTR below the expected average. Action: work the content to climb, or create a better-targeted page.
On our audit, we find 140 low-CTR opportunities, 30 scattered and 30 underexploited. The top of the ranking is striking:
A query in position 4,7 on Google, with 24 763 impressions in 90 days… and 7 clicks. CTR: 0,03 %. The snippet does absolutely nothing to attract the click. A few minutes to rewrite the title and the meta description, and that's potentially several hundred clicks gained over the same period without touching the content.
Each opportunity row can be expanded to see the ranking URLs, their CTR vs expected CTR, their impressions and their clicks. From there, you have everything you need to decide which one to work on first.
Chain into the other Horusium tools
In the Tools column of each row, the falcon-head icon opens a menu that chains the query into the other Horusium modules: launch an SEO audit on the URL + keyword, start an SEO writing job on the query, or run a keyword research around it. The form opens pre-filled in a new tab: no need to retype, no URL copy-paste. If a resource already exists on your account (a previous audit, for example), a direct link to the existing one appears as well.
Step 8 — Monitor trends
Last tab, and not the least useful: Trends. It automatically identifies the URLs growing and the URLs declining over the period, by comparing two consecutive windows.
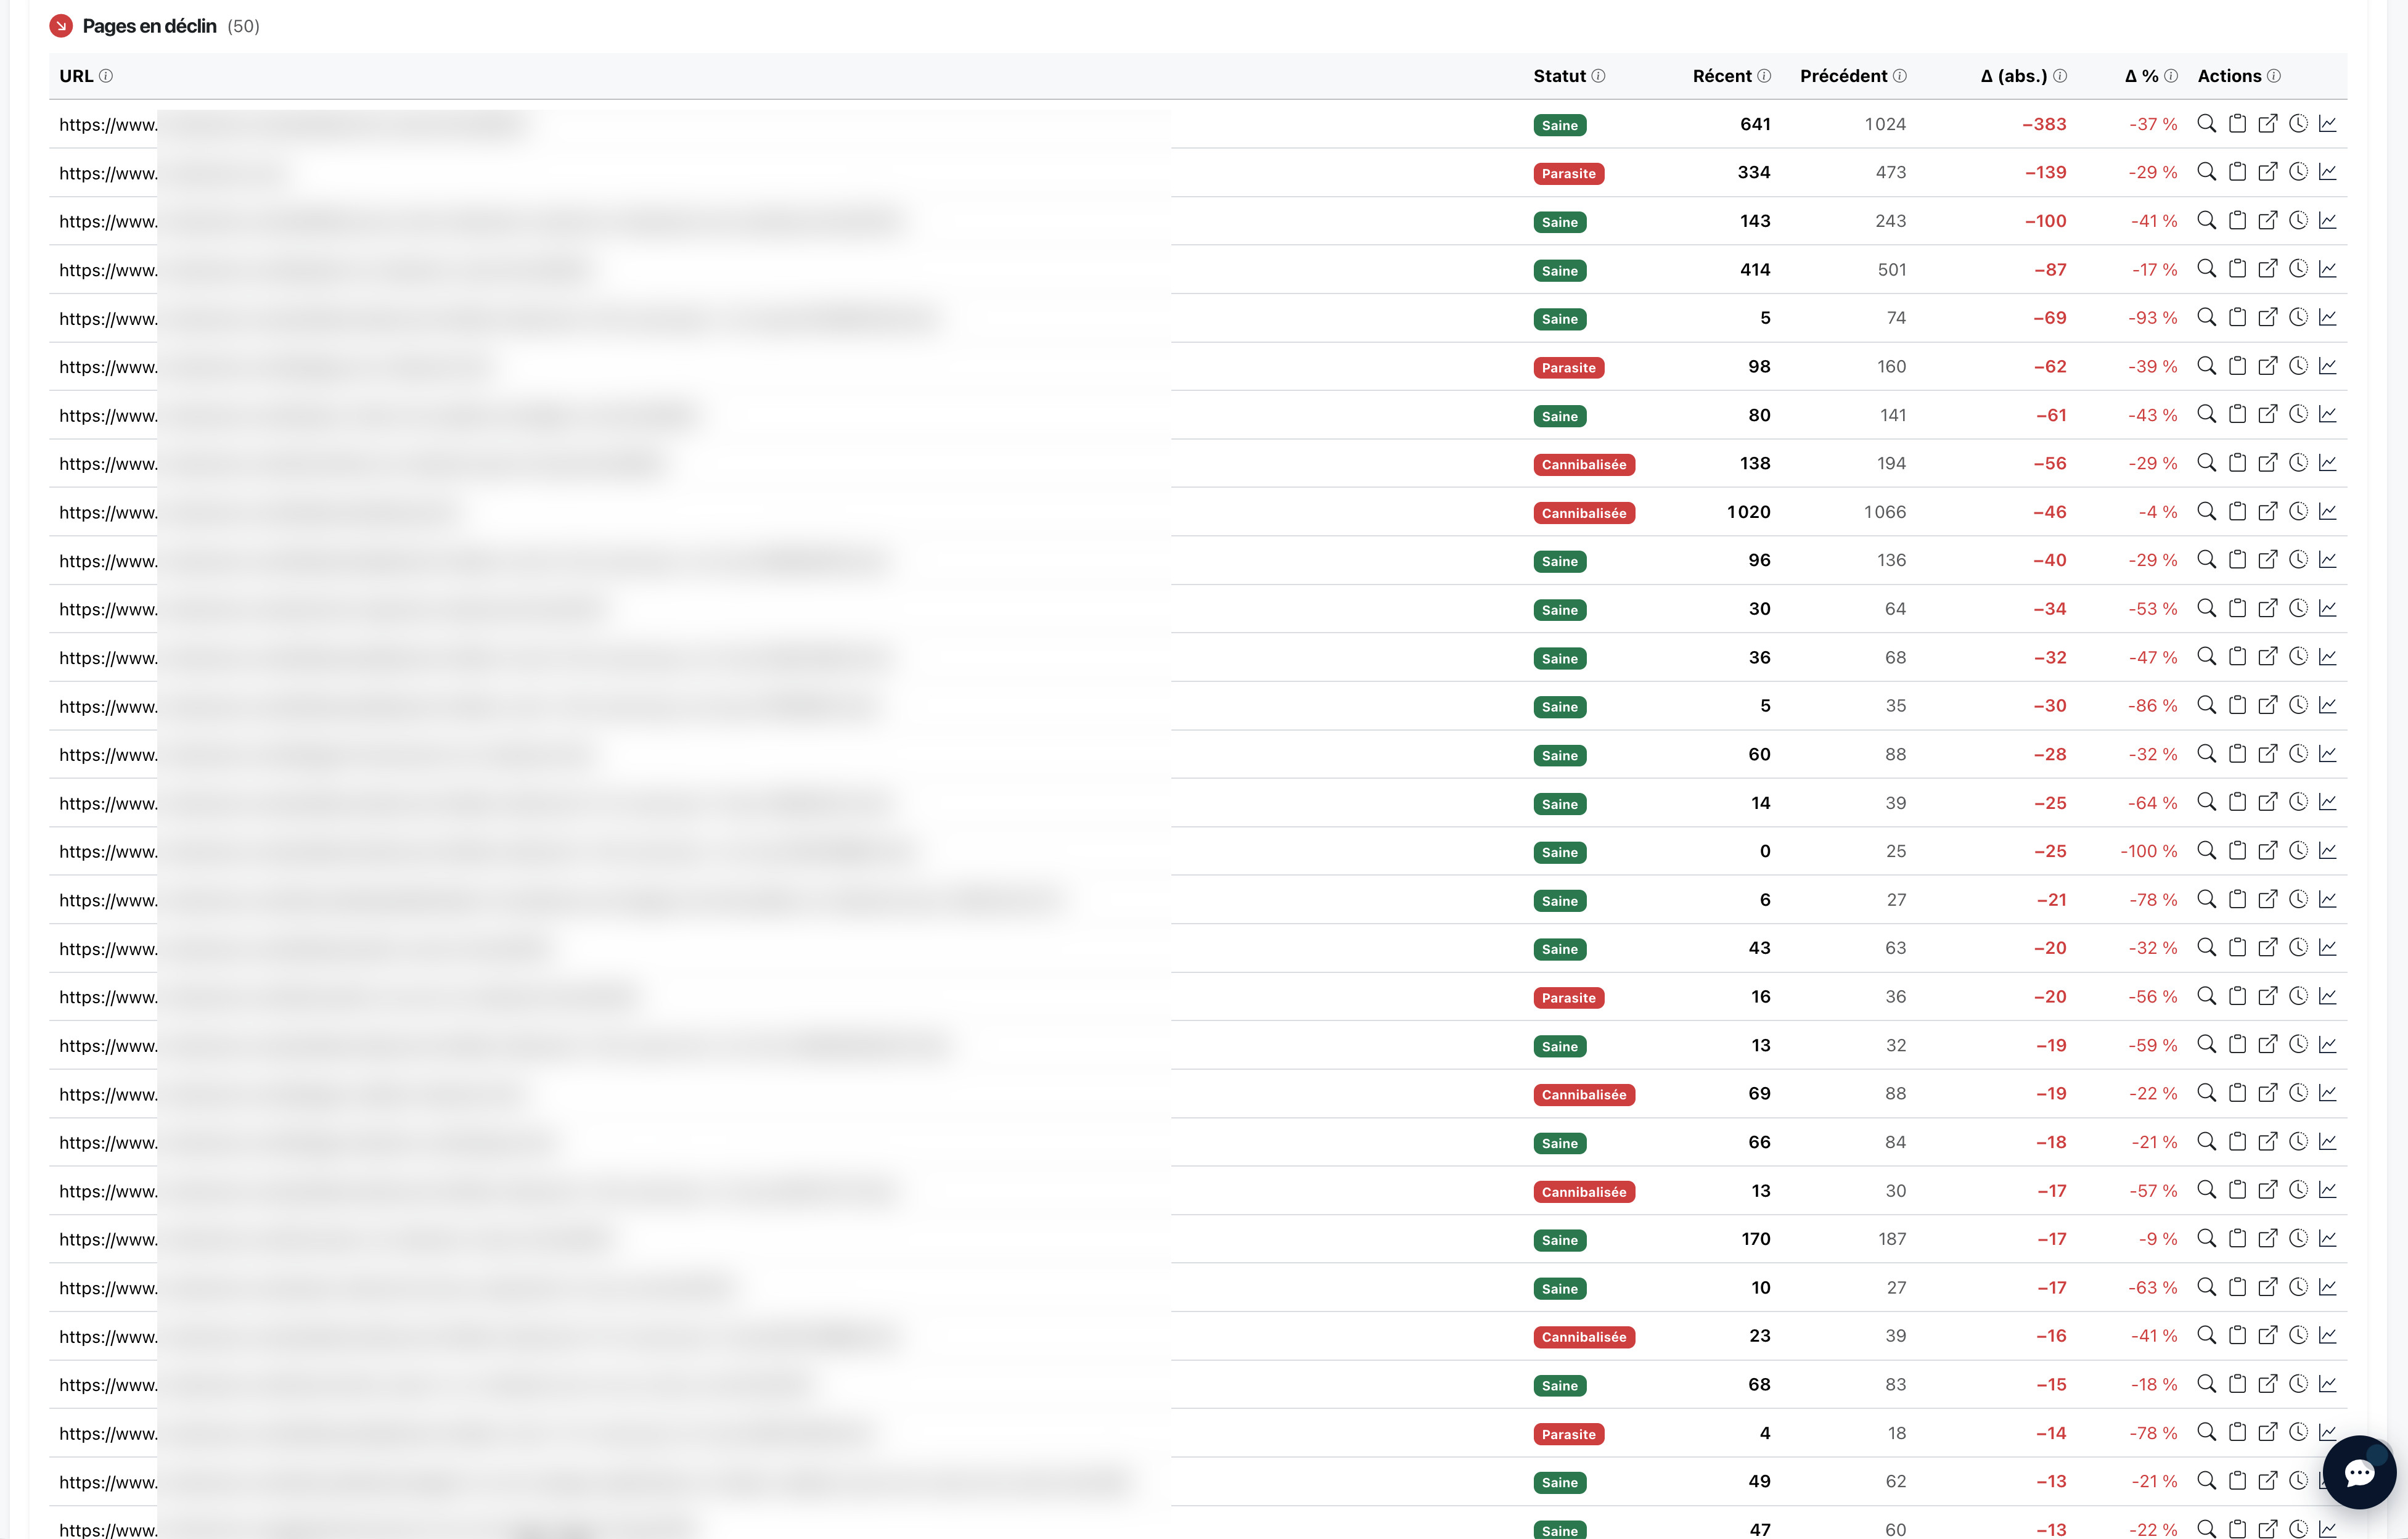
Three splits to choose from: half / half over the period, 30 d vs 30 d, or 7 d vs 7 d. And three metrics: clicks, impressions, position (a gain = a rise in the SERP, not the opposite). For each listed URL, a mini-curve of its evolution opens on click, with the Google updates projected on it — exactly like the Dashboard curve, but centered on the URL.
On method, I always look at both directions, and not only the gains:
- Growing URLs tell me what's working right now — where to add extra internal linking to accelerate, where to look for other similar opportunities.
- Declining URLs are my alert system: a page dropping on its clicks or positions is often the signal of a recent problem — a competitor who released more complete content, a Google update, a technical issue, obsolete content…
Bonus — Regex tags to steer a large site
When a site exceeds a few hundred pages, staring at a flat table of 7 586 URLs becomes unreadable. The module offers a feature that changes everything: regex tags.
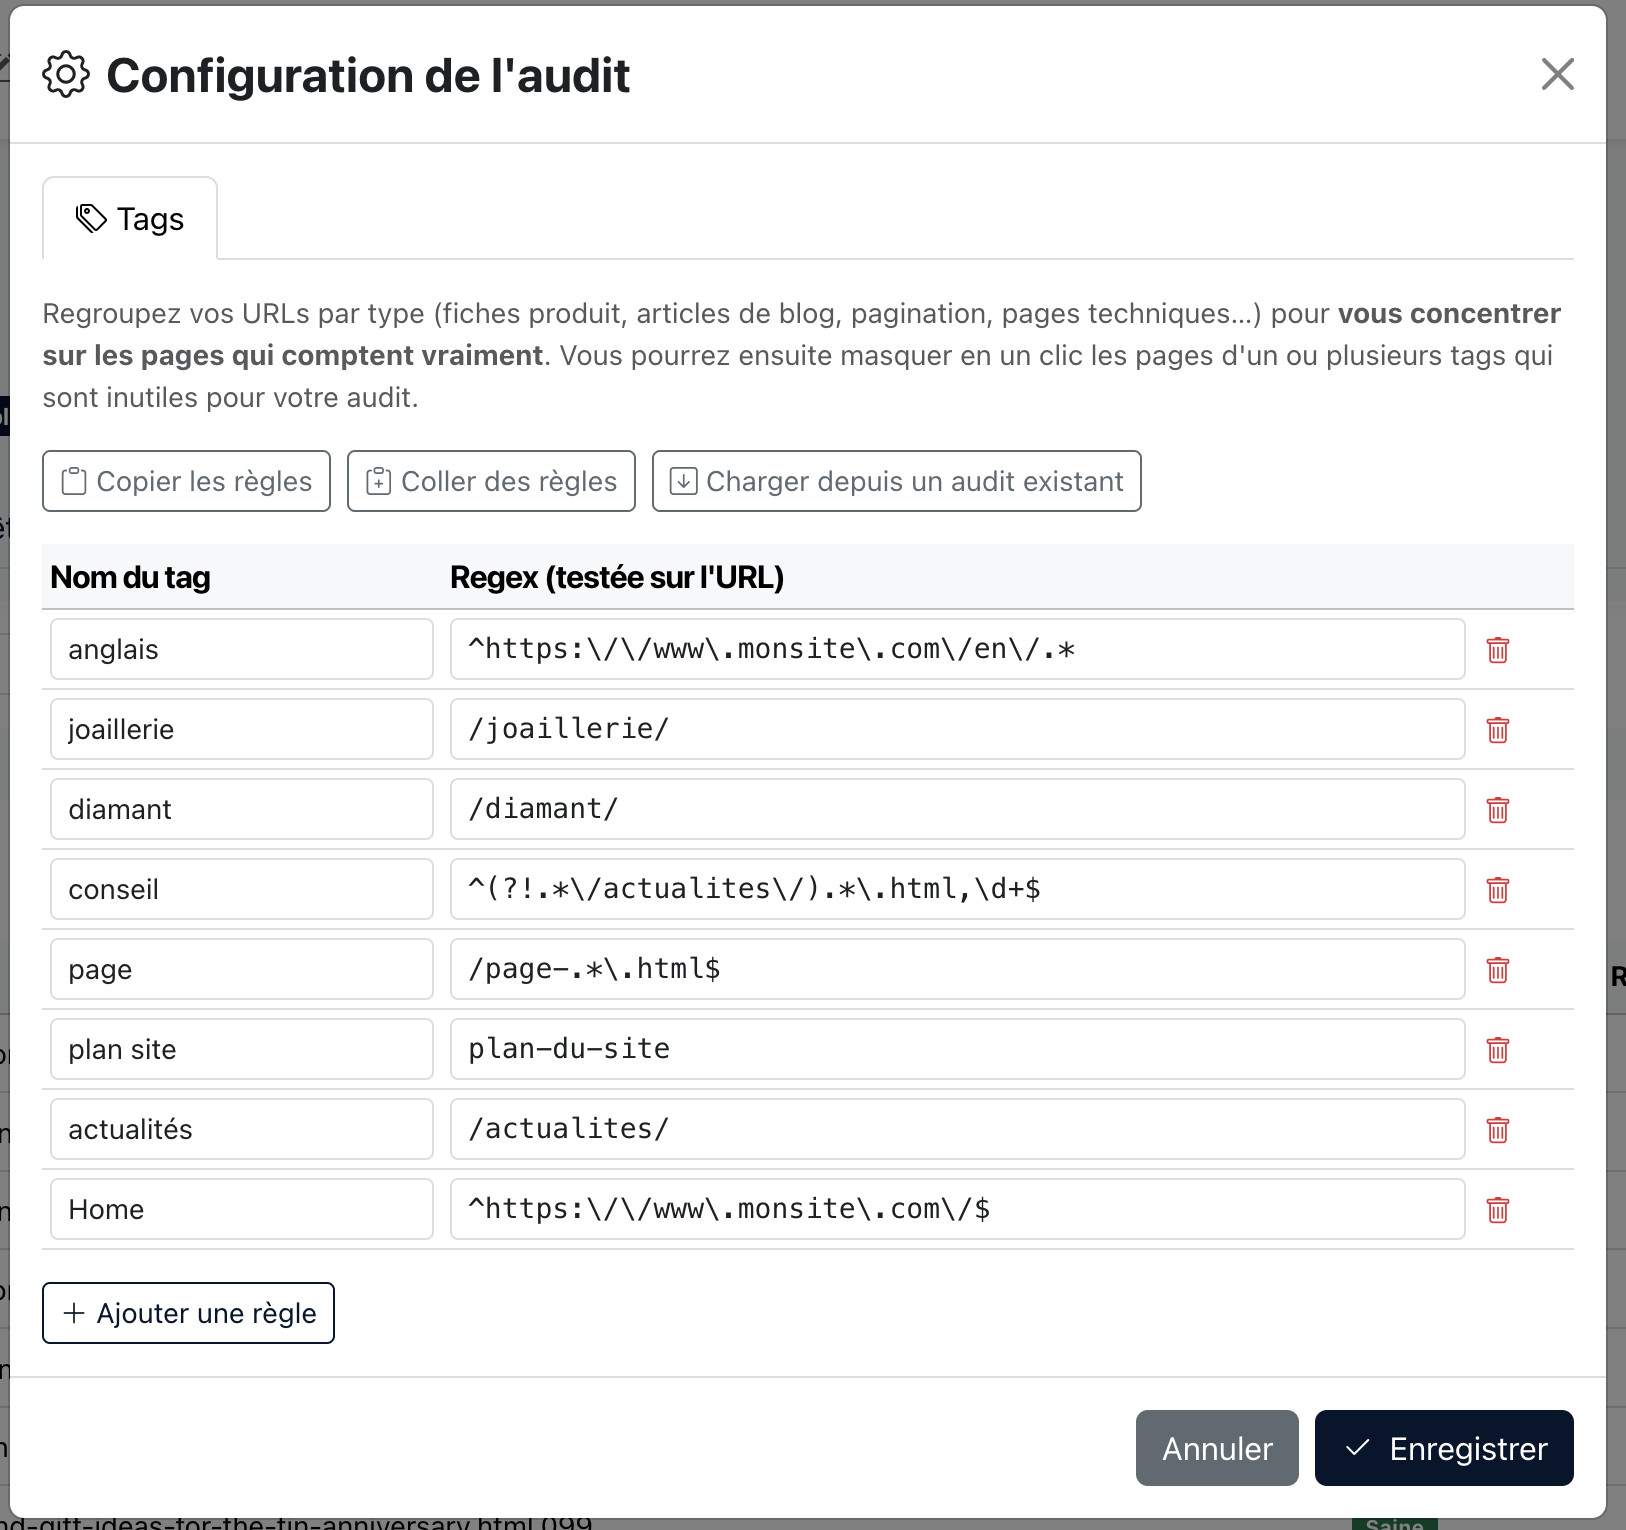
The principle: you define named rules (a regular expression + a label) that automatically qualify your URLs. On our site, we set eight useful rules:
- Joaillerie (main product category pages);
- Diamant (specific sub-category);
- Conseil (editorial pages / buying guides);
- Actualités (old news articles);
- Page (listing pagination);
- Plan du site, Home, Anglais (out-of-scope segments);
Each URL then inherits its tags automatically in the table, and the badges are clickable. But the real power is elsewhere: you can hide a tag with a click, and the entire diagnosis is recomputed in real time, ignoring the tagged pages. Concretely:
- Hide Anglais: you steer only the French scope. The “healthy pages”, “zombies”, “parasites” ratios recompute only on the fr scope.
- Hide Actualités: you remove the old news articles to steer only the product catalog + the living editorial.
- Hide Page: you remove the pagination pages (which are structurally zombies without that being a problem) to get a more accurate read of the real catalog.
On hover over a tag, a tooltip shows the share of clicks and impressions captured by that segment of the site. Very useful to know where your SEO value really lies before deciding what to focus your efforts on.
A small tip: the Configuration modal lets you copy your rules (clipboard) or load them from another audit. Very useful when you re-run an audit of the same site — over another period, or simply later to track the evolution: no need to redefine the eight rules, you replay them as-is on the new audit. And incidentally, if you manage several sites with a similar structure, you can also transpose a “pagination” or “English version” regex from one site to another.
The method, in summary
We start from an outside view (the Search Console data) that we turn into a prioritized action plan in six steps: reading the Dashboard, handling the parasites, cleaning up the zombies and weak pages, seizing the opportunities, monitoring the trends, segmenting by tags for large sites.
What makes the method profitable is the order of attack. We start by neutralizing the leaks (parasites) before pushing the opportunities: no point investing in new content if an old page grabs the queries on the way. We clean, then we accelerate. At each audit cycle (every 3 or 6 months depending on your editorial pace), we re-measure and adjust.
The tool does the diagnosis and proposes the plan; the trade-offs — what you delete, what you keep, what you merge — remain yours. That's precisely what makes the approach reproducible from one site to another, with no magic recipe.